TL;DR

Prime made for students and young adults
- Fast, free delivery for dorm and study essentials
- Prime Video and Amazon Music included
- Member-only deals
Radiaverse presents a public, community-built map based on dose-rate tracks recorded by RadiaCode detector owners. The site reported 50,038,744 measurement points, 20,349 tracks and 2,712 contributors; it does not provide an independent validation of the readings or a complete account of geographic coverage.
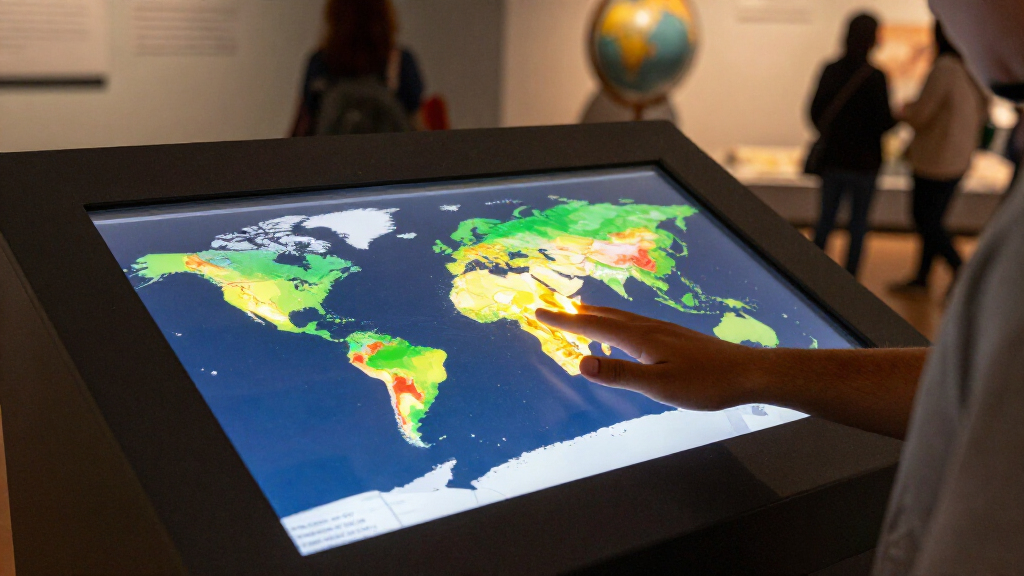
Radiaverse is presenting a public map that combines radiation dose-rate recordings from people using RadiaCode detectors, reporting more than 50 million measurement points across 20,349 tracks. The project gives visitors a way to browse submitted measurements and place descriptions, but the figures and safeguards described here come from Radiaverse, and the source material does not establish that the dataset has been independently audited.
The website listed 50,038,744 dose-rate points, 20,349 tracks, 1,141 areas and 2,712 contributors. It describes the measurements as recordings made by community members while walking, driving or flying with a RadiaCode detector. The site also says measurements feed a shared map layer displayed as hexagons. Its dashboard was labeled live and said it had updated 31 minutes earlier, but the report provided no calendar date for that reading.
According to Radiaverse, the map is free to browse, while an account is required to publish a track. Users record dose rate and location through a RadiaCode device and app, then choose whether to share a recording. Tracks remain private by default, and the site says public tracks can be posted anonymously. Users can also submit an area with photos and context, and discuss mapped locations with others.
The map includes community-described locations and a feed of recent contributions. Radiaverse’s popular-area list includes sites associated with the Goiânia cesium-137 accident, a Budapest research reactor, a mine in Romania and a Fukushima hot spot. Those entries reflect the site’s community content and ranking, not an official hazard assessment. The source does not provide measurement protocols, calibration records or independent confirmation for the listed readings.
A Public Map Built From User Readings
The project makes radiation readings that would otherwise remain in individual device logs visible in a shared geographic format. That can help users explore how measurements vary across places and identify locations that community members have documented. The site’s area descriptions and photos may also give readers context that a measurement point alone cannot provide.
But a map of user-submitted readings is not the same as an official monitoring network or a comprehensive account of radiation exposure. Readings can depend on the detector, its calibration, the route and conditions of collection, and how a measurement is interpreted. Radiaverse does not establish in the supplied material that its displayed data are representative of all locations or suitable for assessing health risks. Readers should treat the map as a community resource rather than a substitute for guidance from public-health or radiation-protection authorities.
Popular right now

Bose QuietComfort True Wireless Earbuds with Active Noise Cancellation, Black

Ninja Foodi Smart Dual Heat Air Fry Oven, 13-in-1, Silver (SP351)

LG 85-Inch QNED73B Mini LED 4K Smart TV (2026)
As an affiliate, we earn on qualifying purchases.
How Tracks Become Map Points
Radiaverse says each contribution starts with a RadiaCode detector that records dose rate and location. A user can publish the track through the app, after which its points contribute to the map. The service says it uses coverage counts based on unique cells at street resolution, so travelling the same road more than once does not increase that coverage count. The report lists a total number of measurement points and tracks, but does not give the map’s full geographic distribution or explain how the totals are calculated beyond that coverage note.
The site describes several controls for location privacy and data quality. It says public tracks are delayed by 24 hours, measurements with GPS accuracy worse than 15 metres are excluded, and readings inside protected locations are removed from public view. New areas and edits are reviewed by moderators. Radiaverse also says public interfaces do not provide raw GPS tracks and that scraping is rate-limited and blocked. These are descriptions of the platform’s own practices; the supplied report does not include an external review of their implementation.
“Everything on the map is public and free to browse. An account is only needed to publish.”
— Radiaverse
Limits of the Published Readings
The supplied report does not state when the displayed totals were collected, how frequently they change, or what share of the world has been measured. It also does not identify independent reviewers, explain detector calibration or give a detailed method for resolving inconsistent readings. As a result, the reported count of 50,038,744 points describes the platform’s displayed dataset, not independently verified coverage or measurement accuracy.
It is also unclear how the site’s privacy and moderation controls have been tested in practice, how moderators handle disputed measurements, or whether every mapped area has supporting evidence beyond user submissions. The listed locations and their rankings should not be read as proof that a place is dangerous, safe or representative of conditions nearby. Radiaverse’s source material does not make those claims.
Further Data and Platform Details
Radiaverse says users can continue to add tracks, areas, photos and comments, and that its community feed follows new activity. The page also invites visitors to start by exploring measurements near home or to contribute using a RadiaCode detector and app. Its dashboard refers to weekly measurements and tracks over the preceding six months, although the supplied report does not show the values for those measures.
For readers evaluating the map, the next useful details would be a dated snapshot of its totals, clearer documentation of data collection and calibration, and information about how readings are checked or corrected. Until those details are available, the map’s stated counts and safeguards should be attributed to Radiaverse, while its measurements remain community-submitted data rather than independently confirmed findings.
Key Questions
What is the Radiaverse radiation map?
It is a public map that Radiaverse says aggregates dose-rate tracks recorded by RadiaCode detector users. The site also lets contributors describe areas and add photos or context.
How many measurements does the map report?
The supplied report lists 50,038,744 measurement points, 20,349 tracks, 1,141 areas and 2,712 contributors. The dashboard was marked as updated 31 minutes earlier, but no calendar date was given.
Are the readings independently verified?
The source material does not describe independent verification or provide calibration records. Radiaverse says it excludes readings with GPS accuracy worse than 15 metres and reviews new areas and edits, but those platform practices are not an independent audit of the measurements.
Does the map show whether a place is dangerous?
Not on the evidence provided. The map presents community measurements and descriptions; the source does not establish that its entries are official hazard assessments or a substitute for public-health guidance.
How does Radiaverse say it protects contributors’ locations?
Radiaverse says tracks are private until users choose to publish, public tracks can hide the contributor’s identity, and published tracks are delayed by 24 hours. It also says raw GPS tracks are not provided through public interfaces. These protections are described by the platform itself.
Source: radiaverse.com